一、Helm包管理器
1.1 什么是Helm?
Kubernetes 包管理器
Helm 是查找、分享和使用软件构件 Kubernetes 的最优方式。
Helm 管理名为 chart 的 Kubernetes 包的工具。Helm 可以做以下的事情:
- 从头开始创建新的 chart
- 将 chart 打包成归档(tgz)文件
- 与存储 chart 的仓库进行交互
- 在现有的 Kubernetes 集群中安装和卸载 chart
- 管理与 Helm 一起安装的 chart 的发布周期
对于Helm,有三个重要的概念:
- chart 创建Kubernetes应用程序所必需的一组信息。
- config 包含了可以合并到打包的chart中的配置信息,用于创建一个可发布的对象。
- release 是一个与特定配置相结合的chart的运行实例。
1.2 Helm架构
1.2.1 重要概念
- chart: chart 创建 Kubernetes 应用程序所必需的一组信息。
- config: config 包含了可以合并到打包的 chart 中的配置信息,用于创建一个可发布的对象。
- release: release 是一个与特定配置相结合的 chart 的运行实例。
1.2.2 组件
Helm客户端
Helm 客户端 是终端用户的命令行客户端。负责以下内容:
- 本地 chart 开发
- 管理仓库
- 管理发布
- 与 Helm 库建立接口
- 发送安装的 chart
- 发送升级或卸载现有发布的请求
Helm库
Helm 库 提供执行所有 Helm 操作的逻辑。与 Kubernetes API 服务交互并提供以下功能:
- 结合 chart 和配置来构建版本
- 将 chart 安装到 Kubernetes 中,并提供后续发布对象
- 与 Kubernetes 交互升级和卸载 chart
独立的 Helm 库封装了 Helm 逻辑以便不同的客户端可以使用它。
1.3 安装Helm
https://helm.sh/zh/docs/intro/install/
1
2
3
4
5
6
7
8
9
10
|
wget https://get.helm.sh/helm-v3.14.4-linux-amd64.tar.gz
tar zxvf helm-v3.14.4-linux-amd64.tar.gz
mv linux-amd64/helm /usr/local/bin/
|
1.4 Helm的常用命令
1
2
3
4
5
6
7
8
9
10
11
12
| helm repo
helm search
helm pull
helm create
helm dependency
helm install
helm list
helm lint
helm package
helm rollback
helm uninstall
helm upgrade
|
1.5 chart详解
1.5.1 目录结构
1
2
3
4
5
6
7
8
9
10
11
12
13
| mychart
├── Chart.yaml
├── charts
├── templates
│ ├── NOTES.txt
│ ├── _helpers.tpl
│ ├── deployment.yaml
│ ├── ingress.yaml
│ ├── service.yaml
│ ├── serviceaccount.yaml
│ └── tests
│ └── test-connection.yaml
└── values.yaml
|
1.5.2 Redis chart实践
修改helm源
1
2
3
4
5
6
|
helm repo list
helm repo add bitnami https://charts.bitnami.com/bitnami
helm repo add azure http://mirror.azure.cn/kubernetes/charts
|
搜索redis chart
1
2
3
4
5
|
helm search repo redis
helm show readme bitnami/redis
|
修改配置安装
1
2
3
4
5
6
7
8
9
10
11
12
13
14
15
16
17
18
19
|
helm pull bitnami/redis
tar zxvf redis-19.1.5.tgz
kubectl create namespace redis-test
cd ../
helm install redis ./redis -n redis-test
|
查看安装情况
1
2
3
4
5
|
helm list
kubectl get all -n redis-test
|
升级与回滚
1
2
3
4
5
6
7
8
9
10
11
12
13
| 要想升级 chart 可以修改本地的 chart 配置并执行:
helm upgrade [RELEASE] [CHART] [flags]
helm upgrade redis ./redis -n redis-test
使用 helm ls 的命令查看当前运行的 chart 的 release 版本,并使用下面的命令回滚到历史版本:
helm rollback <RELEASE> [REVISION] [flags]
helm history redis
helm rollback redis -n redis-test
helm rollback redis 3 -n redis-test
|
helm卸载redis
1
| helm delete redis -n redis
|
二、k8s集群监控
2.1 监控方案
Heapster
Heapster 是容器集群监控和性能分析工具,天然的支持Kubernetes 和 CoreOS。
Kubernetes 有个出名的监控 agent—cAdvisor。在每个kubernetes Node 上都会运行 cAdvisor,它会收集本机以及容器的监控数据(cpu,memory,filesystem,network,uptime)。
在较新的版本中,K8S 已经将 cAdvisor 功能集成到 kubelet 组件中。每个 Node 节点可以直接进行 web 访问。
Weave Scope
Weave Scope 可以监控 kubernetes 集群中的一系列资源的状态、资源使用情况、应用拓扑、scale、还可以直接通过浏览器进入容器内部调试等,其提供的功能包括:
- 交互式拓扑界面
- 图形模式和表格模式
- 过滤功能
- 搜索功能
- 实时度量
- 容器排错
- 插件扩展
Prometheus
Prometheus 是一套开源的监控系统、报警、时间序列的集合,最初由 SoundCloud 开发,后来随着越来越多公司的使用,于是便独立成开源项目。自此以后,许多公司和组织都采用了 Prometheus 作为监控告警工具。
2.2 Prometheus 监控 k8s
2.2.1 自定义配置
2.2.1.1 创建 ConfigMap 配置
1
2
3
4
5
6
7
8
9
10
11
12
13
14
15
16
17
18
19
20
21
22
23
24
25
26
27
28
29
30
31
32
33
34
35
36
37
38
39
40
41
42
43
44
45
46
47
48
49
50
51
52
53
54
55
56
57
58
59
60
61
62
63
64
65
66
67
68
69
70
71
72
73
74
75
76
77
78
79
80
81
82
83
84
85
86
87
88
89
90
91
92
93
94
95
96
97
98
99
100
101
102
103
104
105
106
107
108
109
110
111
112
113
114
115
116
117
118
119
120
121
122
123
124
125
126
127
128
129
130
131
132
133
134
135
136
137
138
139
140
141
142
143
144
145
146
147
148
149
150
151
152
153
154
155
156
157
158
159
160
161
162
163
164
165
166
167
168
169
170
|
apiVersion: v1
kind: ConfigMap
metadata:
name: prometheus-config
namespace: kube-monitoring
data:
prometheus.yml: |
global:
scrape_interval: 15s
evaluation_interval: 15s
scrape_configs:
- job_name: 'prometheus'
static_configs:
- targets: ['localhost:9090']
- job_name: 'kubernetes-nodes'
tls_config:
ca_file: /var/run/secrets/kubernetes.io/serviceaccount/ca.crt
bearer_token_file: /var/run/secrets/kubernetes.io/serviceaccount/token
kubernetes_sd_configs:
- role: node
- job_name: 'kubernetes-service'
tls_config:
ca_file: /var/run/secrets/kubernetes.io/serviceaccount/ca.crt
bearer_token_file: /var/run/secrets/kubernetes.io/serviceaccount/token
kubernetes_sd_configs:
- role: service
- job_name: 'kubernetes-endpoints'
tls_config:
ca_file: /var/run/secrets/kubernetes.io/serviceaccount/ca.crt
bearer_token_file: /var/run/secrets/kubernetes.io/serviceaccount/token
kubernetes_sd_configs:
- role: endpoints
- job_name: 'kubernetes-ingress'
tls_config:
ca_file: /var/run/secrets/kubernetes.io/serviceaccount/ca.crt
bearer_token_file: /var/run/secrets/kubernetes.io/serviceaccount/token
kubernetes_sd_configs:
- role: ingress
- job_name: 'kubernetes-kubelet'
scheme: https
tls_config:
ca_file: /var/run/secrets/kubernetes.io/serviceaccount/ca.crt
bearer_token_file: /var/run/secrets/kubernetes.io/serviceaccount/token
kubernetes_sd_configs:
- role: node
relabel_configs:
- action: labelmap
regex: __meta_kubernetes_node_label_(.+)
- target_label: __address__
replacement: kubernetes.default.svc:443
- source_labels: [__meta_kubernetes_node_name]
regex: (.+)
target_label: __metrics_path__
replacement: /api/v1/nodes/${1}/proxy/metrics
- job_name: 'kubernetes-cadvisor'
scheme: https
tls_config:
ca_file: /var/run/secrets/kubernetes.io/serviceaccount/ca.crt
bearer_token_file: /var/run/secrets/kubernetes.io/serviceaccount/token
kubernetes_sd_configs:
- role: node
relabel_configs:
- target_label: __address__
replacement: kubernetes.default.svc:443
- source_labels: [__meta_kubernetes_node_name]
regex: (.+)
target_label: __metrics_path__
replacement: /api/v1/nodes/${1}/proxy/metrics/cadvisor
- action: labelmap
regex: __meta_kubernetes_node_label_(.+)
- job_name: 'kubernetes-pods'
kubernetes_sd_configs:
- role: pod
relabel_configs:
- source_labels: [__meta_kubernetes_pod_annotation_prometheus_io_scrape]
action: keep
regex: true
- source_labels: [__meta_kubernetes_pod_annotation_prometheus_io_path]
action: replace
target_label: __metrics_path__
regex: (.+)
- source_labels: [__address__, __meta_kubernetes_pod_annotation_prometheus_io_port]
action: replace
regex: ([^:]+)(?::\d+)?;(\d+)
replacement: $1:$2
target_label: __address__
- action: labelmap
regex: __meta_kubernetes_pod_label_(.+)
- source_labels: [__meta_kubernetes_namespace]
action: replace
target_label: kubernetes_namespace
- source_labels: [__meta_kubernetes_pod_name]
action: replace
target_label: kubernetes_pod_name
- job_name: 'kubernetes-apiservers'
kubernetes_sd_configs:
- role: endpoints
scheme: https
tls_config:
ca_file: /var/run/secrets/kubernetes.io/serviceaccount/ca.crt
bearer_token_file: /var/run/secrets/kubernetes.io/serviceaccount/token
relabel_configs:
- source_labels: [__meta_kubernetes_namespace, __meta_kubernetes_service_name, __meta_kubernetes_endpoint_port_name]
action: keep
regex: default;kubernetes;https
- target_label: __address__
replacement: kubernetes.default.svc:443
- job_name: 'kubernetes-services'
metrics_path: /probe
params:
module: [http_2xx]
kubernetes_sd_configs:
- role: service
relabel_configs:
- source_labels: [__meta_kubernetes_service_annotation_prometheus_io_probe]
action: keep
regex: true
- source_labels: [__address__]
target_label: __param_target
- target_label: __address__
replacement: blackbox-exporter.default.svc.cluster.local:9115
- source_labels: [__param_target]
target_label: instance
- action: labelmap
regex: __meta_kubernetes_service_label_(.+)
- source_labels: [__meta_kubernetes_namespace]
target_label: kubernetes_namespace
- source_labels: [__meta_kubernetes_service_name]
target_label: kubernetes_name
- job_name: 'kubernetes-ingresses'
metrics_path: /probe
params:
module: [http_2xx]
kubernetes_sd_configs:
- role: ingress
relabel_configs:
- source_labels: [__meta_kubernetes_ingress_annotation_prometheus_io_probe]
action: keep
regex: true
- source_labels: [__meta_kubernetes_ingress_scheme,__address__,__meta_kubernetes_ingress_path]
regex: (.+);(.+);(.+)
replacement: ${1}://${2}${3}
target_label: __param_target
- target_label: __address__
replacement: blackbox-exporter.default.svc.cluster.local:9115
- source_labels: [__param_target]
target_label: instance
- action: labelmap
regex: __meta_kubernetes_ingress_label_(.+)
- source_labels: [__meta_kubernetes_namespace]
target_label: kubernetes_namespace
- source_labels: [__meta_kubernetes_ingress_name]
target_label: kubernetes_name
|
2.2.1.2 创建 Prometheus 配置
1
2
3
4
5
6
7
8
9
10
11
12
13
14
15
16
17
18
19
20
21
22
23
24
25
26
27
28
29
30
31
32
33
34
35
36
37
38
39
40
41
42
43
44
45
46
47
48
49
50
51
52
53
54
55
56
57
58
59
60
61
62
63
|
apiVersion: v1
kind: Service
metadata:
name: prometheus
labels:
name: prometheus
namespace: kube-monitoring
spec:
ports:
- name: prometheus
protocol: TCP
port: 9090
targetPort: 9090
selector:
app: prometheus
type: NodePort
---
apiVersion: apps/v1
kind: Deployment
metadata:
labels:
name: prometheus
name: prometheus
namespace: kube-monitoring
spec:
replicas: 1
selector:
matchLabels:
app: prometheus
template:
metadata:
labels:
app: prometheus
spec:
serviceAccountName: prometheus
serviceAccount: prometheus
containers:
- name: prometheus
image: prom/prometheus
command:
- "/bin/prometheus"
args:
- "--config.file=/etc/prometheus/prometheus.yml"
ports:
- containerPort: 9090
protocol: TCP
volumeMounts:
- mountPath: "/etc/prometheus"
name: prometheus-config
- mountPath: "/etc/localtime"
name: timezone
volumes:
- name: prometheus-config
configMap:
name: prometheus-config
- name: timezone
hostPath:
path: /usr/share/zoneinfo/Asia/Shanghai
kubectl exec -it <pod name> -- ls /var/run/secrets/kubernetes.io/serviceaccount/
|
2.2.1.3 配置访问权限
1
2
3
4
5
6
7
8
9
10
11
12
13
14
15
16
17
18
19
20
21
22
23
24
25
26
27
28
29
30
31
32
33
34
35
36
37
38
39
40
41
42
43
44
|
apiVersion: rbac.authorization.k8s.io/v1
kind: ClusterRole
metadata:
name: prometheus
rules:
- apiGroups: [""]
resources:
- nodes
- nodes/proxy
- services
- endpoints
- pods
verbs: ["get", "list", "watch"]
- apiGroups:
- extensions
resources:
- ingresses
verbs: ["get", "list", "watch"]
- nonResourceURLs: ["/metrics"]
verbs: ["get"]
---
apiVersion: v1
kind: ServiceAccount
metadata:
name: prometheus
namespace: kube-monitoring
---
apiVersion: rbac.authorization.k8s.io/v1
kind: ClusterRoleBinding
metadata:
name: prometheus
roleRef:
apiGroup: rbac.authorization.k8s.io
kind: ClusterRole
name: prometheus
subjects:
- kind: ServiceAccount
name: prometheus
namespace: kube-monitoring
kubectl exec -it <pod name> -- ls /var/run/secrets/kubernetes.io/serviceaccount/
|
2.2.1.4 系统时间同步
1
2
3
4
5
|
date
ntpdate cn.pool.ntp.org
|
2.2.1.5 创建命名空间配置
1
2
3
4
5
|
apiVersion: v1
kind: Namespace
metadata:
name: kube-monitoring
|
2.2.1.6 监控 k8s 集群
Exporter 监控资源使用情况
1
2
3
4
5
6
7
8
9
10
11
12
13
14
15
16
17
18
19
20
21
22
23
24
25
26
27
28
29
30
|
apiVersion: apps/v1
kind: DaemonSet
metadata:
name: node-exporter
namespace: kube-monitoring
spec:
selector:
matchLabels:
app: node-exporter
template:
metadata:
annotations:
prometheus.io/scrape: 'true'
prometheus.io/port: '9100'
prometheus.io/path: 'metrics'
labels:
app: node-exporter
name: node-exporter
spec:
containers:
- image: prom/node-exporter
imagePullPolicy: IfNotPresent
name: node-exporter
ports:
- containerPort: 9100
hostPort: 9100
name: scrape
hostNetwork: true
hostPID: true
|
对 Ingress 和 Service 进行网络探测
1
2
3
4
5
6
7
8
9
10
11
12
13
14
15
16
17
18
19
20
21
22
23
24
25
26
27
28
29
30
31
32
33
34
35
36
37
38
|
apiVersion: v1
kind: Service
metadata:
labels:
app: blackbox-exporter
name: blackbox-exporter
namespace: kube-monitoring
spec:
ports:
- name: blackbox
port: 9115
protocol: TCP
selector:
app: blackbox-exporter
type: ClusterIP
---
apiVersion: apps/v1
kind: Deployment
metadata:
labels:
app: blackbox-exporter
name: blackbox-exporter
namespace: kube-monitoring
spec:
replicas: 1
selector:
matchLabels:
app: blackbox-exporter
template:
metadata:
labels:
app: blackbox-exporter
spec:
containers:
- image: prom/blackbox-exporter
imagePullPolicy: IfNotPresent
name: blackbox-exporter
|
2.2.1.7 Grafana可视化
Grafana 是一个通用的可视化工具。‘通用’意味着 Grafana 不仅仅适用于展示 Prometheus 下的监控数据,也同样适用于一些其他的数据可视化需求。在开始使用Grafana之前,我们首先需要明确一些 Grafana下的基本概念,以帮助用户能够快速理解Grafana。
基本概念
数据源(Data Source)
对于Grafana而言,Prometheus这类为其提供数据的对象均称为数据源(Data Source)。目前,Grafana官方提供了对:Graphite, InfluxDB, OpenTSDB, Prometheus, Elasticsearch, CloudWatch的支持。对于Grafana管理员而言,只需要将这些对象以数据源的形式添加到Grafana中,Grafana便可以轻松的实现对这些数据的可视化工作。
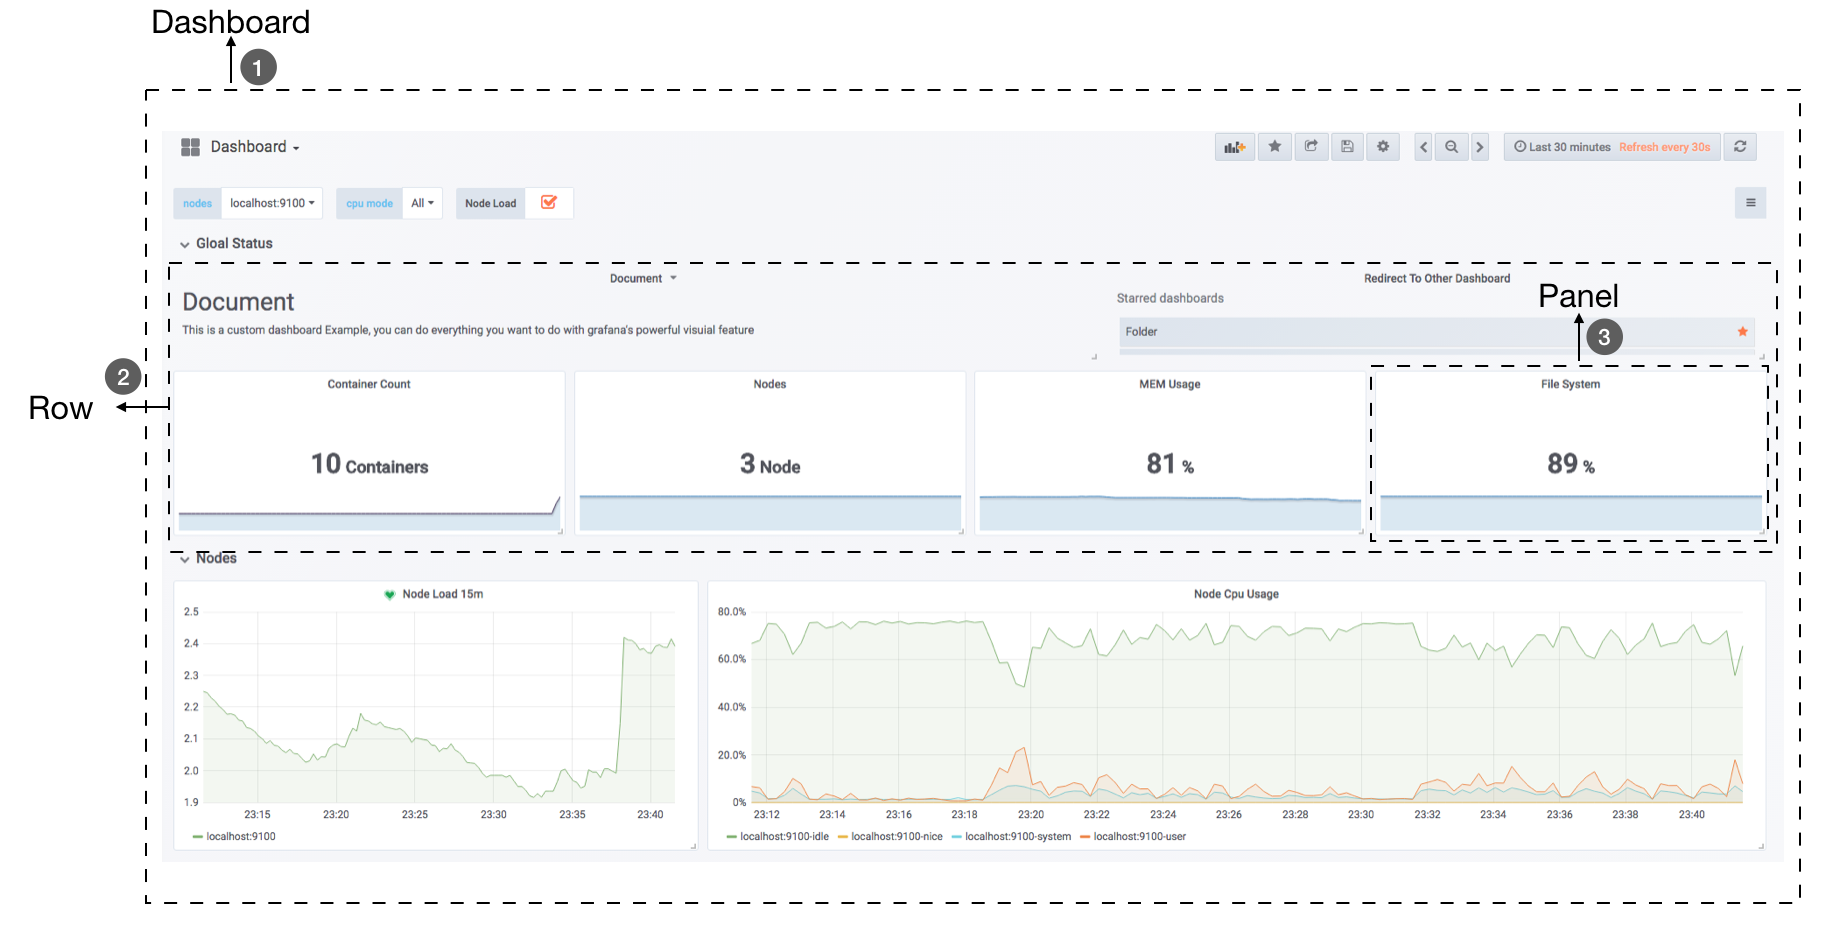
仪表盘(Dashboard)
官方 Dashboard 模板
通过数据源定义好可视化的数据来源之后,对于用户而言最重要的事情就是实现数据的可视化。在Grafana中,我们通过Dashboard来组织和管理我们的数据可视化图表:
集成 Grafana
1
2
3
4
5
6
7
8
9
10
11
12
13
14
15
16
17
18
19
20
21
22
23
24
25
26
27
28
29
30
31
32
33
34
35
36
37
38
39
40
41
42
43
44
45
46
47
48
49
50
51
52
53
54
55
56
57
58
| apiVersion: apps/v1
kind: StatefulSet
metadata:
name: grafana-core
namespace: kube-monitoring
labels:
app: grafana
component: core
spec:
serviceName: "grafana"
selector:
matchLabels:
app: grafana
replicas: 1
template:
metadata:
labels:
app: grafana
component: core
spec:
containers:
- image: grafana/grafana:6.5.3
name: grafana-core
imagePullPolicy: IfNotPresent
env:
- name: GF_AUTH_BASIC_ENABLED
value: "true"
- name: GF_AUTH_ANONYMOUS_ENABLED
value: "false"
readinessProbe:
httpGet:
path: /login
port: 3000
volumeMounts:
- name: grafana-persistent-storage
mountPath: /var/lib/grafana
subPath: grafana
securityContext:
fsGroup: 472
runAsUser: 472
volumeClaimTemplates:
- metadata:
name: grafana-persistent-storage
spec:
storageClassName: nfs-csi
accessModes:
- ReadWriteOnce
resources:
requests:
storage: "1Gi"
|
1
2
3
4
5
6
7
8
9
10
11
12
13
14
15
16
| apiVersion: v1
kind: Service
metadata:
name: grafana
namespace: kube-monitoring
labels:
app: grafana
component: core
spec:
type: NodePort
ports:
- port: 3000
nodePort: 30011
selector:
app: grafana
component: core
|
配置 Grafana 面板
添加 Prometheus 数据源
下载 k8s 面板,导入该面板
2.2.1.8 使用自定义配置创建资源
1
2
3
4
5
6
7
8
9
10
11
12
13
14
15
16
17
18
19
20
|
kubectl create -f ./
kubectl get pods -l app=node-exporter
kubectl get pods -l app=prometheus
kubectl get svc -l name=prometheus
kubectl exec -it <pod name> -- ls /var/run/secrets/kubernetes.io/serviceaccount/
kubectl get daemonsets -l app=node-exporter
kubectl delete -f ./
|
2.2.2 kube-prometheus
项目地址:https://github.com/prometheus-operator/kube-prometheus
创建资源
1
2
3
4
5
6
7
8
9
10
11
12
13
| 下载资源
wget https://github.com/prometheus-operator/kube-prometheus/archive/refs/heads/release-0.11.zip
解压
unzip release-0.11.zip
创建资源
cd kube-prometheus-release-0.11/manifests/
kubectl create -f setup/
kubectl apply -f ./
查看资源
kubectl get all -n monitoring
|
配置 Ingress
1
2
3
4
5
6
7
8
9
10
11
12
13
14
15
16
17
18
19
20
21
22
23
24
25
26
27
28
29
30
31
32
33
34
35
36
37
38
39
40
41
42
43
44
45
46
47
|
192.168.122.110 grafana.xiaoyu123.cn
192.168.122.110 prometheus.xiaoyu123.cn
192.168.122.110 alertmanager.xiaoyu123.cn
apiVersion: networking.k8s.io/v1
kind: Ingress
metadata:
namespace: monitoring
name: prometheus-ingress
spec:
ingressClassName: nginx
rules:
- host: grafana.xiaoyu123.cn
http:
paths:
- path: /
pathType: Prefix
backend:
service:
name: grafana
port:
number: 3000
- host: prometheus.xiaoyu123.cn
http:
paths:
- path: /
pathType: Prefix
backend:
service:
name: prometheus-k8s
port:
number: 9090
- host: alertmanager.xiaoyu123.cn
http:
paths:
- path: /
pathType: Prefix
backend:
service:
name: alertmanager-main
port:
number: 9093
kubectl apply -f prometheus-ingress.yaml
|
卸载
1
2
| kubectl delete -f ./
kubectl delete -f setup/
|
三、ELK日志管理
3.1 ELK 组成
Elasticsearch
ES 作为一个搜索型文档数据库,拥有优秀的搜索能力,以及提供了丰富的 REST API 让我们可以轻松的调用接口。
Filebeat
Filebeat 是一款轻量的数据收集工具
Logstash
通过 Logstash 同样可以进行日志收集,但是若每一个节点都需要收集时,部署 Logstash 有点过重,因此这里主要用到 Logstash 的数据清洗能力,收集交给 Filebeat 去实现
Kibana
Kibana 是一款基于 ES 的可视化操作界面工具,利用 Kibana 可以实现非常方便的 ES 可视化操作
3.2 集成 ELK
部署 es 搜索服务
1
2
3
4
5
6
7
8
9
10
11
12
13
14
15
16
17
18
19
20
21
22
23
24
25
26
27
28
29
30
31
32
33
34
35
36
37
38
39
40
41
42
43
44
45
46
47
48
49
50
51
52
53
54
55
56
57
58
59
60
61
62
63
64
65
66
67
68
69
70
71
72
73
74
75
76
77
78
79
80
81
82
83
84
85
86
87
88
89
90
91
92
93
94
95
96
97
98
99
100
101
102
103
104
105
106
107
108
109
110
111
112
113
114
115
116
117
118
119
120
121
122
123
124
125
126
127
128
129
130
131
132
133
134
135
136
137
138
139
140
141
142
143
144
145
146
147
148
149
150
151
152
153
154
155
156
157
158
159
160
161
162
163
164
165
166
167
168
169
170
171
172
173
174
| # 需要提前给 es 落盘节点打上标签
kubectl label nodes k8s-node1 es=data
# 创建 elasticsearch.yaml
---
apiVersion: v1
kind: Service
metadata:
name: elasticsearch-logging
namespace: kube-logging
labels:
k8s-app: elasticsearch-logging
kubernetes.io/cluster-service: "true"
addonmanager.kubernetes.io/mode: Reconcile
kubernetes.io/name: "Elasticsearch"
spec:
ports:
- port: 9200
protocol: TCP
targetPort: db
selector:
k8s-app: elasticsearch-logging
---
# RBAC authn and authz
apiVersion: v1
kind: ServiceAccount
metadata:
name: elasticsearch-logging
namespace: kube-logging
labels:
k8s-app: elasticsearch-logging
kubernetes.io/cluster-service: "true"
addonmanager.kubernetes.io/mode: Reconcile
---
kind: ClusterRole
apiVersion: rbac.authorization.k8s.io/v1
metadata:
name: elasticsearch-logging
labels:
k8s-app: elasticsearch-logging
kubernetes.io/cluster-service: "true"
addonmanager.kubernetes.io/mode: Reconcile
rules:
- apiGroups:
- ""
resources:
- "services"
- "namespaces"
- "endpoints"
verbs:
- "get"
---
kind: ClusterRoleBinding
apiVersion: rbac.authorization.k8s.io/v1
metadata:
namespace: kube-logging
name: elasticsearch-logging
labels:
k8s-app: elasticsearch-logging
kubernetes.io/cluster-service: "true"
addonmanager.kubernetes.io/mode: Reconcile
subjects:
- kind: ServiceAccount
name: elasticsearch-logging
namespace: kube-logging
apiGroup: ""
roleRef:
kind: ClusterRole
name: elasticsearch-logging
apiGroup: ""
---
# Elasticsearch deployment itself
apiVersion: apps/v1
kind: StatefulSet #使用statefulset创建Pod
metadata:
name: elasticsearch-logging #pod名称,使用statefulSet创建的Pod是有序号有顺序的
namespace: kube-logging #命名空间
labels:
k8s-app: elasticsearch-logging
kubernetes.io/cluster-service: "true"
addonmanager.kubernetes.io/mode: Reconcile
srv: srv-elasticsearch
spec:
serviceName: elasticsearch-logging #与svc相关联,这可以确保使用以下DNS地址访问Statefulset中的每个pod (es-cluster-[0,1,2].elasticsearch.elk.svc.cluster.local)
replicas: 1 #副本数量,单节点
selector:
matchLabels:
k8s-app: elasticsearch-logging #和pod template配置的labels相匹配
template:
metadata:
labels:
k8s-app: elasticsearch-logging
kubernetes.io/cluster-service: "true"
spec:
serviceAccountName: elasticsearch-logging
containers:
- image: docker.io/library/elasticsearch:7.9.3
name: elasticsearch-logging
resources:
# need more cpu upon initialization, therefore burstable class
limits:
cpu: 1000m
memory: 2Gi
requests:
cpu: 100m
memory: 500Mi
ports:
- containerPort: 9200
name: db
protocol: TCP
- containerPort: 9300
name: transport
protocol: TCP
volumeMounts:
- name: elasticsearch-logging
mountPath: /usr/share/elasticsearch/data/ #挂载点
env:
- name: "NAMESPACE"
valueFrom:
fieldRef:
fieldPath: metadata.namespace
- name: "discovery.type" #定义单节点类型
value: "single-node"
- name: ES_JAVA_OPTS #设置Java的内存参数,可以适当进行加大调整
value: "-Xms512m -Xmx2g"
volumes:
- name: elasticsearch-logging
hostPath:
path: /data/es/
nodeSelector: #如果需要匹配落盘节点可以添加 nodeSelect
es: data
tolerations:
- effect: NoSchedule
operator: Exists
# Elasticsearch requires vm.max_map_count to be at least 262144.
# If your OS already sets up this number to a higher value, feel free
# to remove this init container.
initContainers: #容器初始化前的操作
- name: elasticsearch-logging-init
image: alpine:3.6
command: ["/sbin/sysctl", "-w", "vm.max_map_count=262144"] #添加mmap计数限制,太低可能造成内存不足的错误
securityContext: #仅应用到指定的容器上,并且不会影响Volume
privileged: true #运行特权容器
- name: increase-fd-ulimit
image: busybox
imagePullPolicy: IfNotPresent
command: ["sh", "-c", "ulimit -n 65536"] #修改文件描述符最大数量
securityContext:
privileged: true
- name: elasticsearch-volume-init #es数据落盘初始化,加上777权限
image: alpine:3.6
command:
- chmod
- -R
- "777"
- /usr/share/elasticsearch/data/
volumeMounts:
- name: elasticsearch-logging
mountPath: /usr/share/elasticsearch/data/
# 创建 namespace.yaml
apiVersion: v1
kind: Namespace
metadata:
name: kube-logging
# 创建命名空间
kubectl apply -f namespace.yaml
# 创建服务
kubectl apply -f elasticsearch.yaml
# 查看 pod 启用情况
kubectl get pod -n kube-logging
|
部署 logstash 数据清洗
1
2
3
4
5
6
7
8
9
10
11
12
13
14
15
16
17
18
19
20
21
22
23
24
25
26
27
28
29
30
31
32
33
34
35
36
37
38
39
40
41
42
43
44
45
46
47
48
49
50
51
52
53
54
55
56
57
58
59
60
61
62
63
64
65
66
67
68
69
70
71
72
73
74
75
76
77
78
79
80
81
82
83
84
85
86
87
88
89
90
91
92
93
94
95
96
97
98
99
100
101
102
103
104
105
106
107
108
109
110
111
112
113
114
115
116
117
118
119
120
121
122
123
124
125
126
127
128
129
130
131
132
133
134
135
136
137
138
139
140
141
142
143
144
145
146
147
148
149
150
151
152
153
154
155
156
157
158
159
160
161
162
163
164
165
166
167
168
169
170
171
172
173
174
175
176
177
178
179
180
181
182
183
184
185
186
187
188
189
190
191
192
193
194
195
196
197
198
199
200
201
202
203
204
205
206
207
208
209
210
211
212
213
214
215
216
217
218
219
220
221
222
223
224
225
226
227
228
229
230
|
---
apiVersion: v1
kind: Service
metadata:
name: logstash
namespace: kube-logging
spec:
ports:
- port: 5044
targetPort: beats
selector:
type: logstash
clusterIP: None
---
apiVersion: apps/v1
kind: Deployment
metadata:
name: logstash
namespace: kube-logging
spec:
selector:
matchLabels:
type: logstash
template:
metadata:
labels:
type: logstash
srv: srv-logstash
spec:
containers:
- image: docker.io/kubeimages/logstash:7.9.3
name: logstash
ports:
- containerPort: 5044
name: beats
command:
- logstash
- '-f'
- '/etc/logstash_c/logstash.conf'
env:
- name: "XPACK_MONITORING_ELASTICSEARCH_HOSTS"
value: "http://elasticsearch-logging:9200"
volumeMounts:
- name: config-volume
mountPath: /etc/logstash_c/
- name: config-yml-volume
mountPath: /usr/share/logstash/config/
- name: timezone
mountPath: /etc/localtime
resources:
limits:
cpu: 1000m
memory: 2048Mi
requests:
cpu: 512m
memory: 512Mi
volumes:
- name: config-volume
configMap:
name: logstash-conf
items:
- key: logstash.conf
path: logstash.conf
- name: timezone
hostPath:
path: /etc/localtime
- name: config-yml-volume
configMap:
name: logstash-yml
items:
- key: logstash.yml
path: logstash.yml
---
apiVersion: v1
kind: ConfigMap
metadata:
name: logstash-conf
namespace: kube-logging
labels:
type: logstash
data:
logstash.conf: |-
input {
beats {
port => 5044
}
}
filter {
# 处理 ingress 日志
if [kubernetes][container][name] == "nginx-ingress-controller" {
json {
source => "message"
target => "ingress_log"
}
if [ingress_log][requesttime] {
mutate {
convert => ["[ingress_log][requesttime]", "float"]
}
}
if [ingress_log][upstremtime] {
mutate {
convert => ["[ingress_log][upstremtime]", "float"]
}
}
if [ingress_log][status] {
mutate {
convert => ["[ingress_log][status]", "float"]
}
}
if [ingress_log][httphost] and [ingress_log][uri] {
mutate {
add_field => {"[ingress_log][entry]" => "%{[ingress_log][httphost]}%{[ingress_log][uri]}"}
}
mutate {
split => ["[ingress_log][entry]","/"]
}
if [ingress_log][entry][1] {
mutate {
add_field => {"[ingress_log][entrypoint]" => "%{[ingress_log][entry][0]}/%{[ingress_log][entry][1]}"}
remove_field => "[ingress_log][entry]"
}
} else {
mutate {
add_field => {"[ingress_log][entrypoint]" => "%{[ingress_log][entry][0]}/"}
remove_field => "[ingress_log][entry]"
}
}
}
}
# 处理以srv进行开头的业务服务日志
if [kubernetes][container][name] =~ /^srv*/ {
json {
source => "message"
target => "tmp"
}
if [kubernetes][namespace] == "kube-logging" {
drop{}
}
if [tmp][level] {
mutate{
add_field => {"[applog][level]" => "%{[tmp][level]}"}
}
if [applog][level] == "debug"{
drop{}
}
}
if [tmp][msg] {
mutate {
add_field => {"[applog][msg]" => "%{[tmp][msg]}"}
}
}
if [tmp][func] {
mutate {
add_field => {"[applog][func]" => "%{[tmp][func]}"}
}
}
if [tmp][cost]{
if "ms" in [tmp][cost] {
mutate {
split => ["[tmp][cost]","m"]
add_field => {"[applog][cost]" => "%{[tmp][cost][0]}"}
convert => ["[applog][cost]", "float"]
}
} else {
mutate {
add_field => {"[applog][cost]" => "%{[tmp][cost]}"}
}
}
}
if [tmp][method] {
mutate {
add_field => {"[applog][method]" => "%{[tmp][method]}"}
}
}
if [tmp][request_url] {
mutate {
add_field => {"[applog][request_url]" => "%{[tmp][request_url]}"}
}
}
if [tmp][meta._id] {
mutate {
add_field => {"[applog][traceId]" => "%{[tmp][meta._id]}"}
}
}
if [tmp][project] {
mutate {
add_field => {"[applog][project]" => "%{[tmp][project]}"}
}
}
if [tmp][time] {
mutate {
add_field => {"[applog][time]" => "%{[tmp][time]}"}
}
}
if [tmp][status] {
mutate {
add_field => {"[applog][status]" => "%{[tmp][status]}"}
convert => ["[applog][status]", "float"]
}
}
}
mutate {
rename => ["kubernetes", "k8s"]
remove_field => "beat"
remove_field => "tmp"
remove_field => "[k8s][labels][app]"
}
}
output {
elasticsearch {
hosts => ["http://elasticsearch-logging:9200"]
codec => json
index => "logstash-%{+YYYY.MM.dd}" #索引名称以logstash+日志进行每日新建
}
}
---
apiVersion: v1
kind: ConfigMap
metadata:
name: logstash-yml
namespace: kube-logging
labels:
type: logstash
data:
logstash.yml: |-
http.host: "0.0.0.0"
xpack.monitoring.elasticsearch.hosts: http://elasticsearch-logging:9200
|
部署 filebeat 数据采集
1
2
3
4
5
6
7
8
9
10
11
12
13
14
15
16
17
18
19
20
21
22
23
24
25
26
27
28
29
30
31
32
33
34
35
36
37
38
39
40
41
42
43
44
45
46
47
48
49
50
51
52
53
54
55
56
57
58
59
60
61
62
63
64
65
66
67
68
69
70
71
72
73
74
75
76
77
78
79
80
81
82
83
84
85
86
87
88
89
90
91
92
93
94
95
96
97
98
99
100
101
102
103
104
105
106
107
108
109
110
111
112
113
114
115
116
117
118
119
120
121
122
123
124
125
126
127
128
129
130
131
132
133
134
135
136
137
138
139
140
141
142
143
144
145
146
147
148
149
150
151
152
153
154
155
156
157
|
---
apiVersion: v1
kind: ConfigMap
metadata:
name: filebeat-config
namespace: kube-logging
labels:
k8s-app: filebeat
data:
filebeat.yml: |-
filebeat.inputs:
- type: container
enable: true
paths:
- /var/log/containers/*.log #这里是filebeat采集挂载到pod中的日志目录
processors:
- add_kubernetes_metadata: #添加k8s的字段用于后续的数据清洗
host: ${NODE_NAME}
matchers:
- logs_path:
logs_path: "/var/log/containers/"
#output.kafka: #如果日志量较大,es中的日志有延迟,可以选择在filebeat和logstash中间加入kafka
# hosts: ["kafka-log-01:9092", "kafka-log-02:9092", "kafka-log-03:9092"]
# topic: 'topic-test-log'
# version: 2.0.0
output.logstash: #因为还需要部署logstash进行数据的清洗,因此filebeat是把数据推到logstash中
hosts: ["logstash:5044"]
enabled: true
---
apiVersion: v1
kind: ServiceAccount
metadata:
name: filebeat
namespace: kube-logging
labels:
k8s-app: filebeat
---
apiVersion: rbac.authorization.k8s.io/v1
kind: ClusterRole
metadata:
name: filebeat
labels:
k8s-app: filebeat
rules:
- apiGroups: [""]
resources:
- namespaces
- pods
verbs: ["get", "watch", "list"]
---
apiVersion: rbac.authorization.k8s.io/v1
kind: ClusterRoleBinding
metadata:
name: filebeat
subjects:
- kind: ServiceAccount
name: filebeat
namespace: kube-logging
roleRef:
kind: ClusterRole
name: filebeat
apiGroup: rbac.authorization.k8s.io
---
apiVersion: apps/v1
kind: DaemonSet
metadata:
name: filebeat
namespace: kube-logging
labels:
k8s-app: filebeat
spec:
selector:
matchLabels:
k8s-app: filebeat
template:
metadata:
labels:
k8s-app: filebeat
spec:
serviceAccountName: filebeat
terminationGracePeriodSeconds: 30
containers:
- name: filebeat
image: docker.io/kubeimages/filebeat:7.9.3
args: [
"-c", "/etc/filebeat.yml",
"-e","-httpprof","0.0.0.0:6060"
]
env:
- name: NODE_NAME
valueFrom:
fieldRef:
fieldPath: spec.nodeName
- name: ELASTICSEARCH_HOST
value: elasticsearch-logging
- name: ELASTICSEARCH_PORT
value: "9200"
securityContext:
runAsUser: 0
resources:
limits:
memory: 1000Mi
cpu: 1000m
requests:
memory: 100Mi
cpu: 100m
volumeMounts:
- name: config
mountPath: /etc/filebeat.yml
readOnly: true
subPath: filebeat.yml
- name: data
mountPath: /usr/share/filebeat/data
- name: varlibdockercontainers
mountPath: /var/lib
readOnly: true
- name: varlog
mountPath: /var/log/
readOnly: true
- name: timezone
mountPath: /etc/localtime
volumes:
- name: config
configMap:
defaultMode: 0600
name: filebeat-config
- name: varlibdockercontainers
hostPath:
path: /var/lib
- name: varlog
hostPath:
path: /var/log/
- name: inputs
configMap:
defaultMode: 0600
name: filebeat-inputs
- name: data
hostPath:
path: /data/filebeat-data
type: DirectoryOrCreate
- name: timezone
hostPath:
path: /etc/localtime
tolerations:
- effect: NoExecute
key: dedicated
operator: Equal
value: gpu
- effect: NoSchedule
operator: Exists
|
部署 kibana 可视化界面
1
2
3
4
5
6
7
8
9
10
11
12
13
14
15
16
17
18
19
20
21
22
23
24
25
26
27
28
29
30
31
32
33
34
35
36
37
38
39
40
41
42
43
44
45
46
47
48
49
50
51
52
53
54
55
56
57
58
59
60
61
62
63
64
65
66
67
68
69
70
71
72
73
74
75
76
77
78
79
80
81
82
83
84
85
86
87
88
89
90
91
92
93
94
95
96
97
98
99
100
101
102
103
104
|
192.168.113.121 kibana.wolfcode.cn
---
apiVersion: v1
kind: ConfigMap
metadata:
namespace: kube-logging
name: kibana-config
labels:
k8s-app: kibana
data:
kibana.yml: |-
server.name: kibana
server.host: "0"
i18n.locale: zh-CN #设置默认语言为中文
elasticsearch:
hosts: ${ELASTICSEARCH_HOSTS} #es集群连接地址,由于我这都都是k8s部署且在一个ns下,可以直接使用service name连接
---
apiVersion: v1
kind: Service
metadata:
name: kibana
namespace: kube-logging
labels:
k8s-app: kibana
kubernetes.io/cluster-service: "true"
addonmanager.kubernetes.io/mode: Reconcile
kubernetes.io/name: "Kibana"
srv: srv-kibana
spec:
type: NodePort
ports:
- port: 5601
protocol: TCP
targetPort: ui
selector:
k8s-app: kibana
---
apiVersion: apps/v1
kind: Deployment
metadata:
name: kibana
namespace: kube-logging
labels:
k8s-app: kibana
kubernetes.io/cluster-service: "true"
addonmanager.kubernetes.io/mode: Reconcile
srv: srv-kibana
spec:
replicas: 1
selector:
matchLabels:
k8s-app: kibana
template:
metadata:
labels:
k8s-app: kibana
spec:
containers:
- name: kibana
image: docker.io/kubeimages/kibana:7.9.3
resources:
limits:
cpu: 1000m
requests:
cpu: 100m
env:
- name: ELASTICSEARCH_HOSTS
value: http://elasticsearch-logging:9200
ports:
- containerPort: 5601
name: ui
protocol: TCP
volumeMounts:
- name: config
mountPath: /usr/share/kibana/config/kibana.yml
readOnly: true
subPath: kibana.yml
volumes:
- name: config
configMap:
name: kibana-config
---
apiVersion: networking.k8s.io/v1
kind: Ingress
metadata:
name: kibana
namespace: kube-logging
spec:
ingressClassName: nginx
rules:
- host: kibana.wolfcode.cn
http:
paths:
- path: /
pathType: Prefix
backend:
service:
name: kibana
port:
number: 5601
|
Kibana 配置
1
2
3
4
5
6
7
8
9
10
11
12
13
14
15
16
17
18
19
20
21
22
23
24
25
26
27
28
29
30
31
32
33
34
35
36
37
38
39
40
41
42
43
44
45
46
47
48
49
50
51
52
53
54
55
56
57
58
59
60
61
62
63
64
65
66
67
68
69
70
71
72
73
74
75
76
77
78
79
80
81
82
83
84
85
86
87
88
89
90
91
92
93
94
95
96
97
98
99
100
101
102
103
104
105
106
107
| 进入 Kibana 界面,打开菜单中的 Stack Management 可以看到采集到的日志
避免日志越来越大,占用磁盘过多,进入 索引生命周期策略 界面点击 创建策略 按钮
设置策略名称为 logstash-history-ilm-policy
关闭 热阶段
开启删除阶段,设置保留天数为 7 天
保存配置
为了方便在 discover 中查看日志,选择 索引模式 然后点击 创建索引模式 按钮
索引模式名称 里面配置 logstash-*
点击下一步
时间字段 选择 @timestamp
点击 创建索引模式 按钮
由于部署的单节点,产生副本后索引状态会变成 yellow,打开 dev tools,取消所有索引的副本数
PUT _all/_settings
{
"number_of_replicas": 0
}
为了标准化日志中的 map 类型,以及解决链接索引生命周期策略,我们需要修改默认模板
PUT _template/logstash
{
"order": 1,
"index_patterns": [
"logstash-*"
],
"settings": {
"index": {
"lifecycle" : {
"name" : "logstash-history-ilm-policy"
},
"number_of_shards": "2",
"refresh_interval": "5s",
"number_of_replicas" : "0"
}
},
"mappings": {
"properties": {
"@timestamp": {
"type": "date"
},
"applog": {
"dynamic": true,
"properties": {
"cost": {
"type": "float"
},
"func": {
"type": "keyword"
},
"method": {
"type": "keyword"
}
}
},
"k8s": {
"dynamic": true,
"properties": {
"namespace": {
"type": "keyword"
},
"container": {
"dynamic": true,
"properties": {
"name": {
"type": "keyword"
}
}
},
"labels": {
"dynamic": true,
"properties": {
"srv": {
"type": "keyword"
}
}
}
}
},
"geoip": {
"dynamic": true,
"properties": {
"ip": {
"type": "ip"
},
"latitude": {
"type": "float"
},
"location": {
"type": "geo_point"
},
"longitude": {
"type": "float"
}
}
}
}
},
"aliases": {}
}
最后即可通过 discover 进行搜索了
|
四、Kubernetes可视化界面
4.1 Kubernetes Dashboard
4.1.1 安装
1
2
3
4
5
6
7
8
9
10
11
12
13
14
15
16
17
18
19
20
21
22
23
24
25
26
27
| # 下载官方部署配置文件
wget https://raw.githubusercontent.com/kubernetes/dashboard/v2.7.0/aio/deploy/recommended.yaml
# 修改属性
kind: Service
apiVersion: v1
metadata:
labels:
k8s-app: kubernetes-dashboard
name: kubernetes-dashboard
namespace: kubernetes-dashboard
spec:
type: NodePort #新增
ports:
- port: 443
targetPort: 8443
selector:
k8s-app: kubernetes-dashboard
# 创建资源
kubectl apply -f recommend.yaml
# 查看资源是否已经就绪
kubectl get all -n kubernetes-dashboard -o wide
# 访问测试
https://节点ip:端口
|
4.1.2 配置所有权限账号
1
2
3
4
5
6
7
8
9
10
11
12
13
14
15
16
17
18
19
20
21
22
23
24
25
26
27
28
29
30
31
32
33
| # 创建账号配置文件
touch dashboard-admin.yaml
# 配置文件
apiVersion: v1
kind: ServiceAccount
metadata:
labels:
k8s-app: kubernetes-dashboard
name: dashboard-admin
namespace: kubernetes-dashboard
---
apiVersion: rbac.authorization.k8s.io/v1
kind: ClusterRoleBinding
metadata:
name: dashboard-admin-cluster-role
roleRef:
apiGroup: rbac.authorization.k8s.io
kind: ClusterRole
name: cluster-admin
subjects:
- kind: ServiceAccount
name: dashboard-admin
namespace: kubernetes-dashboard
# 创建资源
kubectl apply -f dashboard-admin.yaml
# 查看账号信息
kubectl describe serviceaccount dashboard-admin -n kubernetes-dashboard
# 获取账号的 token 登录 dashboard
kubectl describe secrets dashboard-admin-token-5crbd -n kubernetes-dashboard
|
4.1.3 Dashboard 的使用
4.2 kubesphere
https://kubesphere.io/zh/
KubeSphere 愿景是打造一个以 Kubernetes 为内核的云原生分布式操作系统,它的架构可以非常方便地使第三方应用与云原生生态组件进行即插即用(plug-and-play)的集成,支持云原生应用在多云与多集群的统一分发和运维管理。
4.2.1 本地存储动态PVC
1
2
3
4
5
6
7
8
9
10
11
12
13
14
15
16
17
|
yum install iscsi-initiator-utils -y
systemctl enable --now iscsid
systemctl start iscsid
systemctl status iscsid
kubectl apply -f https://openebs.github.io/charts/openebs-operator.yaml
kubectl get all -n openebs
kubectl apply -f default-storage-class.yaml
|
4.2.2 安装
1
2
3
4
5
6
7
8
9
10
11
12
13
|
kubectl apply -f https://github.com/kubesphere/ks-installer/releases/download/v3.3.1/kubesphere-installer.yaml
kubectl apply -f https://github.com/kubesphere/ks-installer/releases/download/v3.3.1/cluster-configuration.yaml
kubectl logs -n kubesphere-system $(kubectl get pod -n kubesphere-system -l 'app in (ks-install, ks-installer)' -o jsonpath='{.items[0].metadata.name}') -f
kubectl get svc/ks-console -n kubesphere-system
|
4.2.3 启用可插拔组件
https://kubesphere.io/zh/docs/v3.3/pluggable-components/
4.3 Rancher
https://www.rancher.cn/
4.4 Kuboard
https://www.kuboard.cn/